
Budget variance analysis helps finance teams compare actuals against budget, explain performance gaps and act earlier when results move off-plan. It works best when data is current, variance rules are clear and reporting sits in one system. iplicit supports this with connected reporting and better budget visibility.
The value of real-time variance tracking
Performing budget variance analysis without spreadsheets gives finance teams quicker access to current data and a clearer view of where performance is moving off-plan. A more connected reporting approach makes it easier to review actuals against budget, spot material variances earlier and decide what needs attention first.
This guide explains what budget variance analysis is, why it matters for finance teams, the types of variances to track and how to perform the process more accurately. We also cover common reporting issues that slow analysis down and how iplicit helps teams act on variance data sooner.
Our experience
At iplicit, we’ve helped finance teams in organisations as diverse as the Lime Wood hotel group, education charity the Field Studies Council and tech company SEP2 to improve budget visibility and save days every month on reporting.

This experience in reporting automation and real-time visibility gives us a practical view of how finance teams review performance, track budget movement, and act on variance data earlier.
What is budget variance analysis?
Budget variance analysis is the process of comparing actual financial results with the figures set in the budget. It helps teams to identify which reporting lines changed and why.
Budget variance analysis goes beyond simply identifying whether figures are above or below expectations. With it, finance teams can pinpoint the exact drivers of variance, whether it’s pricing, supplier costs or broader operational changes across the business.
For instance, a hotel group may budget £120,000 in monthly food and beverage revenue for one site but report actual revenue of £98,000. Budget variance analysis would highlight the £22,000 shortfall, then help the finance team break it down further by outlet performance, lower footfall, discounting, event cancellations or seasonal demand changes.
Instead of a simple scorecard, you have a powerful diagnostic tool that doesn’t just identify a variance but reveals what’s driving it and where action is needed next.
Why budget variance analysis matters for finance teams

Finance teams need a practical way to understand whether performance is staying in line with plan. Below are four ways budget variance analysis gives that structure and why it remains a core part of management reporting and performance review.
- Improves financial control: Budget variance analysis helps finance teams identify deviations in revenue, costs, payroll or project spend. This makes it easier to investigate material variances early rather than waiting until reporting issues affect wider financial performance.
- Supports faster decision-making: Variance analysis gives management early insight into where changes are coming from. With that clarity, leaders can make faster, smarter decisions before small issues become larger budget problems.
- Strengthens forecasting and planning: By reviewing budget variances regularly, teams can improve future forecasts. This helps them refine their planning assumptions and set more accurate budgets over time.
- Improves accountability across departments: Clear variance reporting gives budget owners better visibility into where performance is on or off plan. This makes it easier to follow up on overspends, delays or missed targets with clearer context and ownership.
Types of budget variances
Budget variances usually fall into two core categories: revenue variances and cost variances. To understand what is driving these gaps, finance leaders typically break them down into more specific types like margin, timing, department, and project variances. Here's a closer look at each.
1. Revenue variance
Revenue variance is the difference between expected income and actual income. For example, if your budget was £500,000 but actual revenue came in at £450,000, you're looking at a negative revenue variance of £50,000.
A negative revenue variance usually points to weaker sales volume, pricing pressure, or delayed billing. Positive variances, on the other hand, reflect stronger demand, better pricing, or higher customer retention.
2. Cost variance
Cost variance is the gap between planned expenditure and actual spend. A lower figure can mean cost savings or activity that simply hasn't kicked off yet. A higher figure usually points to supplier price increases, overtime, or costs that weren't in the original plan. For example, actual spend of £138,000 against a budget of £120,000 creates a positive cost variance of £18,000.
3. Margin variance
Let’s say you targeted a 35% margin but actual results landed at 29%. That 6-point shortfall is your margin variance.
Margin variance tracks the difference between what you projected and what you actually delivered at gross or net level. Negative variances may be due to heavy discounting or costs rising faster than revenue. When it swings positive, it tends to reflect stronger pricing, improved efficiency, or input costs moving in your favour.
4. Timing variance
This happens when income or spend is recorded in a different period from the one originally planned. When it is lower, receipts or payments have usually moved into a later reporting period. When it is higher, income or activity has often been recognised earlier than expected.
For example, receiving £165,000 in customer payments when £200,000 was expected creates a negative timing variance of £35,000.
5. Department variance
Department variance tracks the budget gap within a specific team, function, or cost centre. Lower results usually point to delayed activity, underspend, or resources not being used as planned. Higher figures often indicate overspending on staff, software, or departmental operations.
For instance, a department spending £95,000 against a budget of £80,000 creates a positive department variance of £15,000.
6. Project variance
This measures the gap between a project's estimated and actual delivery costs. If a project starts with a £60,000 budget but actual costs land at £72,000, there is a positive variance of £12,000. This often points to scope changes, supplier overruns, or delivery delays. A lower variance typically means the project is under budget or certain planned work is yet to get started.
Key challenges with spreadsheet-based variance analysis

Spreadsheet-based variance analysis can look manageable at first. But its limits become clear once reporting volumes increase and more people are involved in the process.
The most common challenges include:
- Delayed reporting: Spreadsheet reports are usually built after actuals have been exported from finance systems and reworked manually. Due to this delay, budget teams are often analysing performance after the reporting period is over. This makes it harder to respond to issues early.
- Manual data errors: Exporting, copying, consolidating and updating figures by hand creates more room for mistakes. A single typo, missed row or incorrect range selection can affect the final variance output and make the analysis less reliable.
- Version control problems: When multiple people update or comment on the same spreadsheet, it becomes harder to confirm which file is current. This creates confusion during reviews and weakens governance around budget and forecasting.
- Weak audit trail: Spreadsheets do not usually provide a clear record of who changed a figure or when it was changed. That makes it harder to defend numbers during budget reviews or trace the source of a variance.
- Limited context behind the numbers: A spreadsheet often fails to capture the reason behind variances. Finance teams may still need to chase departments, emails or separate notes to understand what caused the movement and what action is needed.
How to perform budget variance analysis: a step-by-step process
Budget variance analysis works best when teams follow the same review process each reporting period. Here are five essential steps to help you uncover the most important movements:
Step 1: Gather actuals and budget data
Start by pulling actual revenue and expenditure figures. From there, align them directly with the approved budget. The data should be complete, current and structured in the same reporting categories so the comparison is accurate.
For multi-entity organisations, watch for internal transactions or inconsistent coding across entities. Either one can distort group-level reporting.
Step 2: Calculate the variance amount and percentage
Once the data is aligned, calculate the difference between actuals and budget for each reporting line. The value difference shows the direct financial impact. The percentage difference helps finance teams judge whether the movement is minor or material in context.
Step 3: Focus on material variances

Not every variance needs detailed follow-up. Set clear thresholds to filter out minor differences. This way, the team focuses only on movements that impact reporting, forecasts or business decisions.
Step 4: Investigate the cause of each major variance
This is where the analysis moves from what changed to why it changed. The cause may come from pricing, volume, payroll, or supplier costs.
Timing differences, delayed billing or operational decisions may also play a role. To get the full picture, financial teams often need input from budget owners or department leads.
Step 5: Document actions and update the forecast where needed
Once the cause is clear, record the explanation and decide what needs to happen next. That may mean correcting a coding issue, adjusting spend, or following up with a department. If the variance is likely to continue, update the forecast for the rest of the reporting period.
Best practices for accurate budget variance tracking
Accurate budget variance tracking relies on a consistent reporting process across periods. Here are five practices that help:
- Use consistent budget structures across departments, projects, entities and cost centres.
- Set clear materiality thresholds for variances that need review.
- Review variances regularly as part of the monthly reporting cycle.
- Capture commentary early from budget owners and department leads.
- Keep forecasts updated when assumptions or trading conditions change.
How financial systems enable real-time analysis
Financial systems make budget variance analysis more useful by reducing manual reporting steps and giving finance teams quicker access to current data. The main improvements usually include:
- Direct data integration: Instead of copying figures between separate tools, finance systems bring actuals and budgets into the same reporting environment. This reduces manual handling. It also helps keep variance reporting aligned with the latest financial data.
- Automated variance flags: Financial systems can highlight variances once they pass an agreed threshold. Because of this, finance teams skip the manual line-by-line scan and focus on what matters first.
- Dynamic re-forecasting: When a variance reflects a lasting change rather than a one-off timing issue, finance teams can quickly update forecasts and keep the remaining budget aligned with current trading conditions.
- Multi-dimensional drill-down: Finance systems make it easier to move from a headline variance into the transactions, projects or cost centres behind it. That gives teams better context for explaining the movement properly.
- Simplified group-wide reporting: Finance systems bring reporting into one view. This simplifies multi-entity and group accounting, helping teams compare performance more consistently across entities. The single view also reduces errors caused by disconnected files.
How iplicit supports variance analysis and visibility
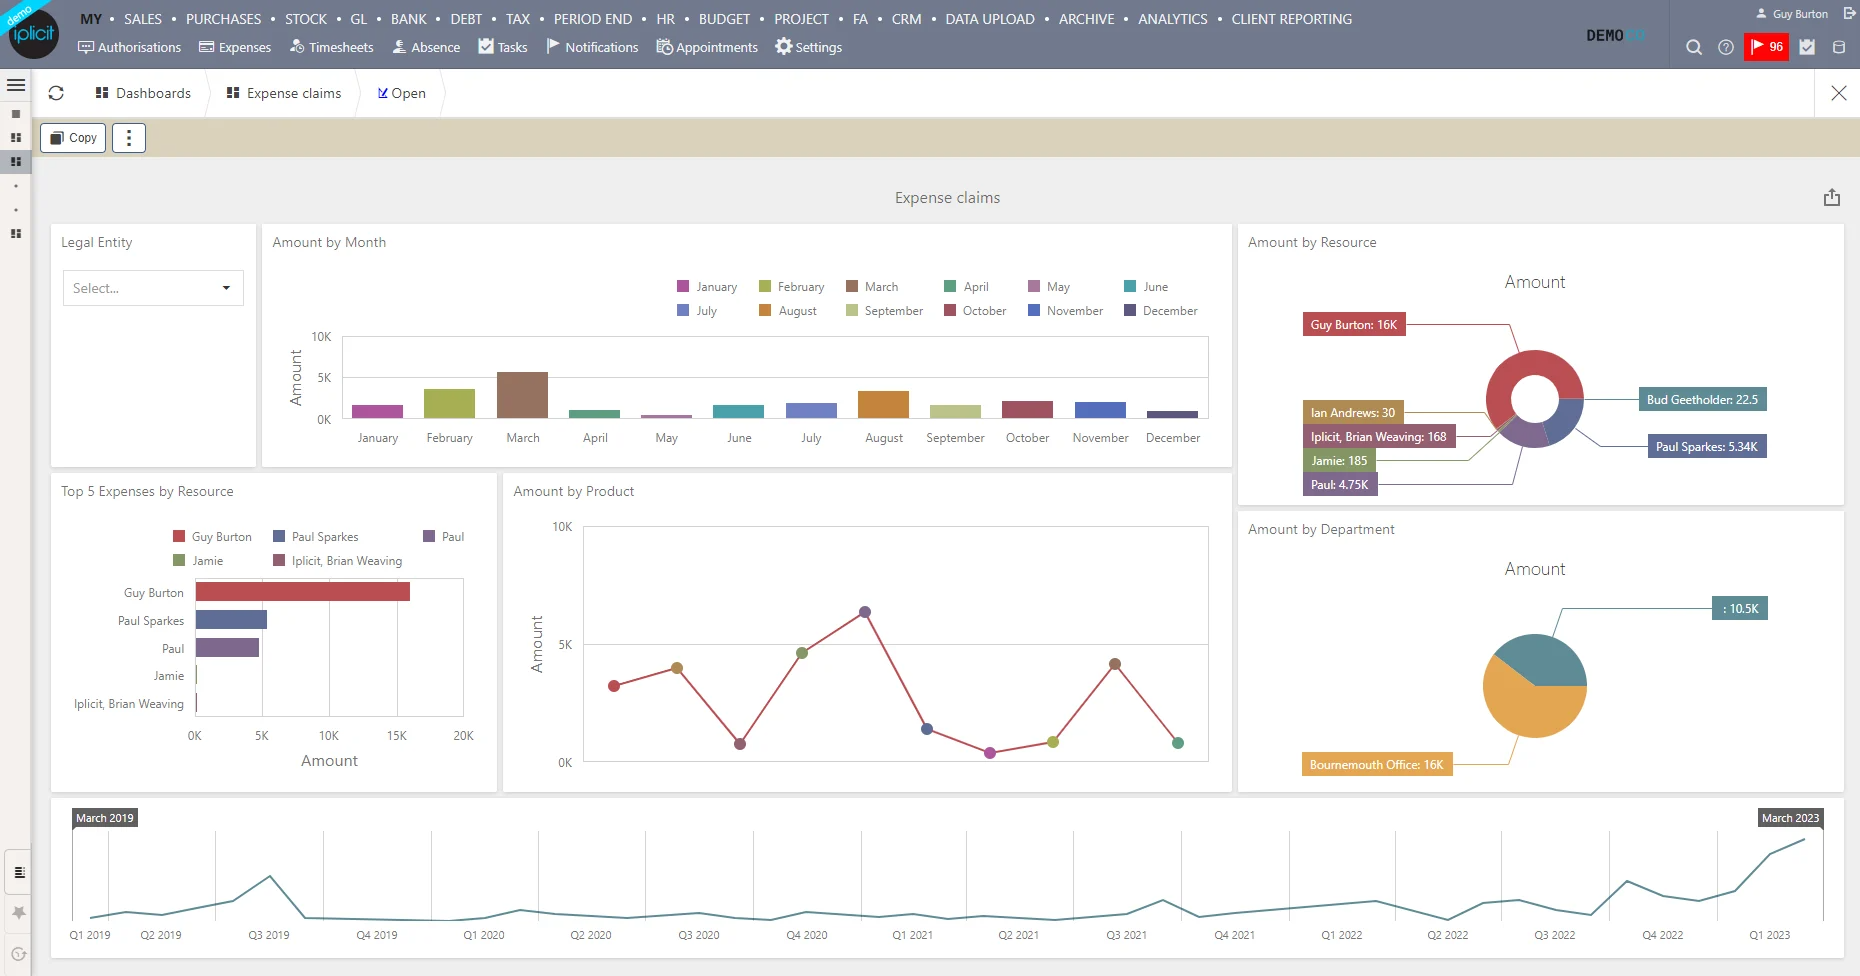
iplicit brings actuals, budgets, approvals and reporting into one connected finance system. This lets finance teams see budget variances clearly and review them in context without jumping between files.
Here are six iplicit features that make budget variance analysis easier.
1. Real-time reporting and dashboards
With iplicit, every transaction shows up across the organisation the moment it's entered into the system. Teams can pull accurate reports at any point in the reporting period. This ensures that budget variances can be spotted earlier, making for easier performance reviews.
2. Advanced budgeting and cost allocation
iplicit supports structured budget management across teams, projects, and business areas. Actual versus budget performance can be tracked using unlimited dimensions across departments, sites, cost centres and entities. Instead of relying only on top-level totals, finance teams can fully identify where overspends are happening and why.
3. Automated workflows and approvals
iplicit replaces manual sign-offs with structured, automated workflows. Budget changes and spend requests follow defined routes, which reduces delays and makes it easier to control spend.
Teams can also build workflows around their own specific requirements or processes. And since iplicit integrates with existing tools, variance analysis no longer starts with hunting down mismatched data.
4. Multi-site and multi-entity management
For organisations with multiple entities or locations, iplicit brings reporting into one unified system. This makes it easier to compare performance consistently and maintain full group-wide visibility.
5. Built-in compliance and audit history
iplicit keeps a full audit trail of every approval, change and supporting document. User permissions and access controls are also built in. As a result, finance teams have better oversight during budget reviews and find it easier to comply with funder, regulator, or statutory requirements.
Final note: Driving strategy through accurate variance tracking
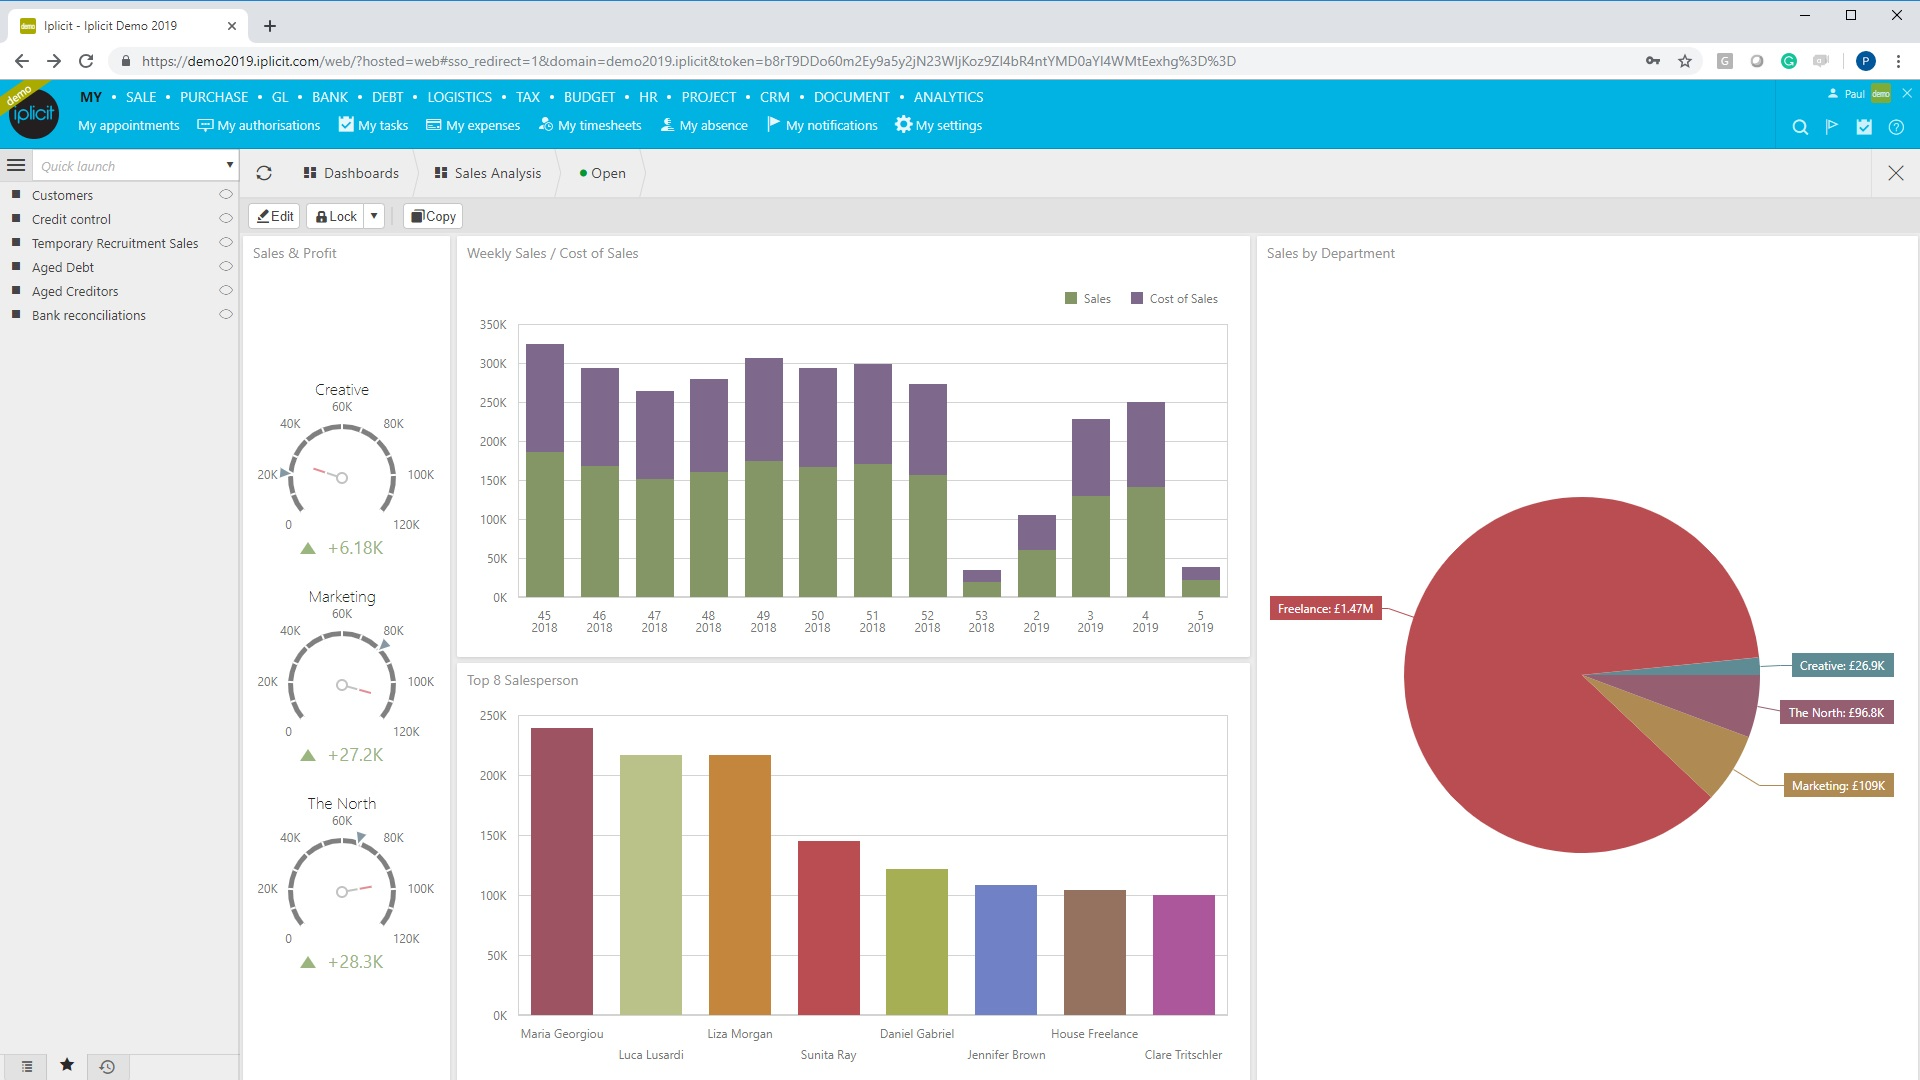
Moving away from manual spreadsheets gives finance teams a more reliable way to track performance against budget. When actuals, budgets and reporting sit in one system, it becomes easier to spot material variances earlier, explain what is driving them and keep reporting aligned across the business.
iplicit brings these elements together in a single platform. With connected reporting and real-time dashboards, budget movements remain visible across departments. Smart automations and workflows reduce the time spent reviewing each line item, so finance teams can focus on eliminating material variances.