
Dashboards are only as trustworthy as the data behind them. This article looks at why finance dashboards lose people's trust – disconnected systems, mismatched customer records, charts of accounts that don't map onto each other – and why a ‘single source of truth’ only means something once you can explain how it's created and kept that way, including how Lincoln Students' Union moved from piecing figures together by hand to a connected, reconciled view of its numbers.
The short version
- A dashboard only shows what's already in the systems beneath it. If those numbers are wrong or incomplete, the dashboard is ineffective, no matter how well the data is presented.
- A handful of causes explain most trust problems: systems connected piecemeal over the years, the same customer or entity recorded differently across systems, charts of accounts that don't map onto each other, and a lack of ownership.
- A ‘single source of truth’ only means something if you can explain how that trusted version is created and maintained.
- Connecting systems so data doesn't need re-entering by hand solves one problem, but it doesn't resolve mismatched categories or unclear ownership.
- 61% of financial planning and analysis (FP&A) professionals cite unreliable data as a barrier to their organisation's use of tech, and 93% still fall back on spreadsheets weekly for reporting, according to AFP's 2025 research.
Most finance teams have been here before: a report goes out, someone asks why the number doesn't match what they saw last week, and the meeting stalls while two people compare spreadsheets to work out who's right.
Usually the argument is pointless, as the two figures were pulled from systems that hadn't agreed with each other. These moments have consequences – people start double-checking figures before they act on them, or stop asking for reports altogether and go back to whatever spreadsheet they trust more.
AFP's most recent benchmarking research found that a majority of FP&A professionals still see unreliable data as a barrier to using the technology they already have. The problem is in the data itself, and a new reporting tool won't fix it.
A dashboard is only as trustworthy as what feeds it
Dashboards are useful as they present data quickly, in a form that is easy to digest and understand. They allow key stakeholders in organisations to view key data without having to request reports from finance, share numbers quickly, spot and deal with anomalies, and free up teams from time spent producing reports.
A dashboard seeming useful doesn't mean the numbers in it are correct. It pulls its figures from whatever systems sit behind it and displays them as given. If a customer is recorded twice, if two systems don't agree on last month's revenue, or if a site's transactions haven't been reconciled yet, the dashboard still shows that data.
The dashboard is only as good as the data that sits behind it.
Recurring causes of dashboard failure
In most organisations, the same handful of issues explain why a report doesn't match what someone expected. Most organisations added finance systems one at a time, over years, rather than designing them to work together. That's why the same problems keep showing up.
- Systems connected piecemeal, one at a time, over several years, rather than designed to work together from the outset. Data ends up being pushed and pulled between them by hand, or through fragile, one-off links and fixes.
- The same customer, supplier or entity recorded slightly differently in different systems. A query for total spend with a particular supplier misses whatever sits under a different spelling or account code.
- Charts of accounts that don't map onto each other. A chart of accounts is the list of categories an organisation records its income, costs, assets and liabilities against. When two systems use different lists, combining their numbers means guessing which category matches which.
- An acquisition or new site arriving with its own systems and its own way of recording things, with nobody tasked with reconciling the two afterwards.
- Manual exports and spreadsheet files carrying numbers between systems. Every manual step is a chance for a figure to be copied, rounded or entered incorrectly.
- No clear ownership of which version of a number is right, so when two reports disagree, resolving it depends on whoever happens to notice.
Why ‘single source of truth’ is an easy phrase to use, but a hard thing to build
“Single source of truth” is one of the most-used phrases in reporting content, and one of the least explained. It only means something if you can describe how that trusted version of the data is created and maintained.
Connecting systems so that data doesn't need re-entering by hand solves a real problem, but a narrower one than the phrase implies. Removing manual re-keying stops one source of error, but it doesn't decide which chart of accounts is correct when two systems disagree, or who owns the definition of a number when finance and operations both lay claim to it.
That distinction played out at Lincoln Students' Union, a charity with two trading subsidiaries that previously relied on spreadsheets to consolidate figures between them each month.
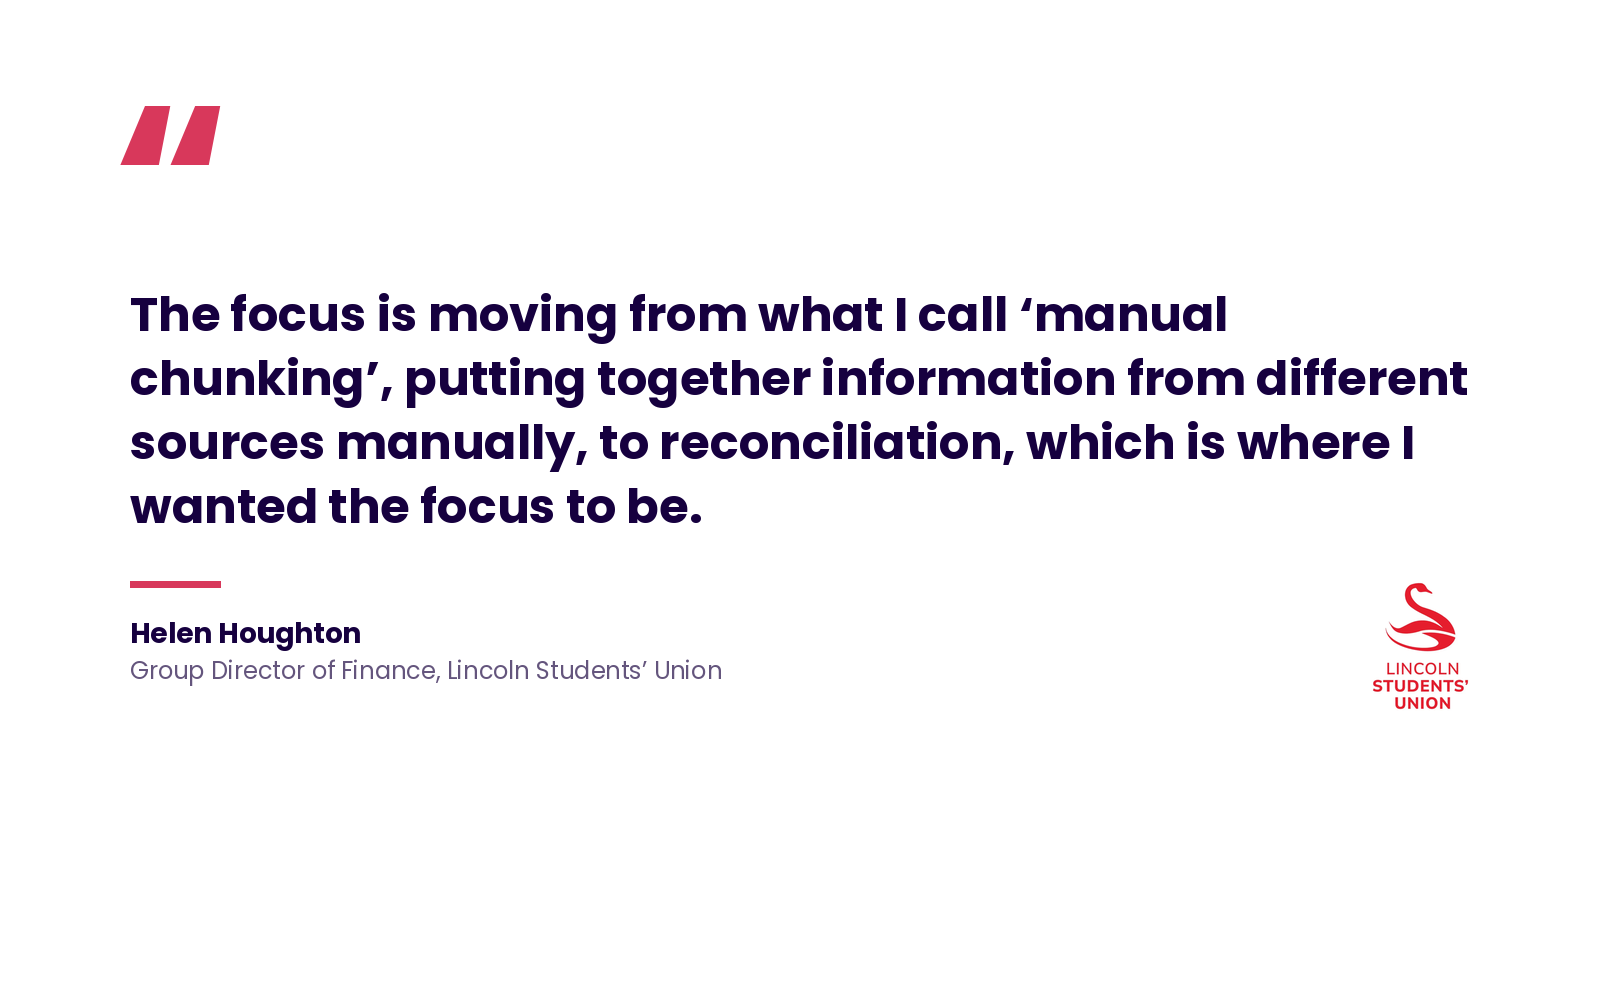
Helen Houghton, the union's Group Director of Finance, describes the shift in practical terms. Connecting the union's finance system directly to its membership platform moved the team's day-to-day work from what she calls ‘manual chunking’ – piecing information together from different sources by hand – to reconciliation: checking that figures which already agree stay that way.
Removing the manual step freed up the time and attention the team needed to ensure the numbers could be trusted.
What this costs an organisation
Untrustworthy data costs more than the time spent double-checking a report. AFP's 2025 benchmarking research among FP&A professionals found that 61% cite a lack of reliable data as a barrier to their organisation's use of technology, and 60% cite a lack of accessible data.
This partly explains why 93% still rely on spreadsheets weekly for reporting, despite reporting tools already being in place.
Spreadsheets aren't the problem in themselves. They're what teams reach for when the systems around them can't produce a consistent number without manual intervention. Every hour spent reconciling spreadsheets to prove a figure is right is an hour not spent using that figure to make a decision.
Fixing the foundation before adding another dashboard
Before commissioning a new report or dashboard, it's worth asking three questions of the data behind it:
- Where does each number come from?
- Who owns the definition of that number?
- How often is it reconciled against the systems it's drawn from?
Without clear answers, a new dashboard will only display the same uncertainty in a more attractive format. These signs suggest the problem is the data underneath, not a missing dashboard:
- Two reports covering the same period regularly show different totals for the same thing, and resolving the difference always needs someone to check manually.
- A significant part of month-end still involves exporting data from one system to reconcile it against another in a spreadsheet.
- Nobody can say, without checking, which system holds the definitive version of a customer, supplier or entity record.
- A recent acquisition or new site is still running on its original systems, with no agreed way of combining its figures with the rest of the group.
If several of these are familiar, a new dashboard won't help much until the data underneath it is fixed.
The fix for your finance dashboard
Organisations that stop trusting their reports are usually right to be cautious. The question is whether anyone has answered where each number comes from, who owns it, and how often it's checked.
That work is less visible than a new dashboard and takes longer to show results, but it's the only version of a single source of truth worth having.
This is the first article in a series on building finance reporting people rely on, working through board packs, budget variances, multiple entities and who gets to see what.
Where iplicit fits
The three questions above are easier to answer when systems are built to work together, rather than patched together after the fact. iplicit connects finance data across a group in real time on a single chart of accounts, with automatic intercompany eliminations and native integrations that remove manual exports, building a single source of truth you can trust. Take a 3-minute quick tour to see how it works.
What does 'single source of truth' mean in finance reporting?
What does 'single source of truth' mean in finance reporting?
It means one trusted, current version of a financial figure that every system and report draws from, rather than each system holding its own version that has to be reconciled by hand. It only means something in practice if there's a clear answer to how that version is created, updated and kept consistent across systems.
What is a chart of accounts?
What is a chart of accounts?
A chart of accounts is the list of categories an organisation records its income, costs, assets and liabilities against. Problems arise when two systems, often after an acquisition or a new site joining the group, use different lists that don't map cleanly onto each other, making it hard to combine their figures accurately.
Why do reports from different systems show different numbers for the same thing?
Why do reports from different systems show different numbers for the same thing?
Usually because the same customer, supplier or transaction has been recorded slightly differently in each system, or because the systems use account categories that don't align. Manual exports between systems add another opportunity for numbers to drift apart before anyone compares the reports.
How do you fix untrustworthy financial data before building a new dashboard?
How do you fix untrustworthy financial data before building a new dashboard?
Start by establishing where each number comes from, who owns its definition, and how often it's reconciled against source systems. Addressing those questions fixes the reason reports disagree in the first place. Adding a new dashboard on top of unresolved data just displays the same disagreement in a different format.